🧭 Tour of the UI
All panels live in View3D → Sidebar (N) → ZOZO’s Contact Solver.
Backend Communicator
The main panel. Profile row (Open / Clear / Reload / Save), server-type
selector (Local, SSH, SSH Command, Docker, Docker over
SSH, Docker over SSH Command, Windows Native), Project Name,
Connect / Disconnect, Start Server on Remote / Stop Server
on Remote, live status line, remote hardware readout, and realtime
statistics. When a port-in-use error is reported, a Force Terminate
Process button surfaces so you can release the port; if the existing
process is itself a ppf-cts-server, the add-on auto-attaches to it on
the next connect. Enable Debug Options at the bottom to unlock
shell, data-transfer, UUID migration, and reload-server tools.
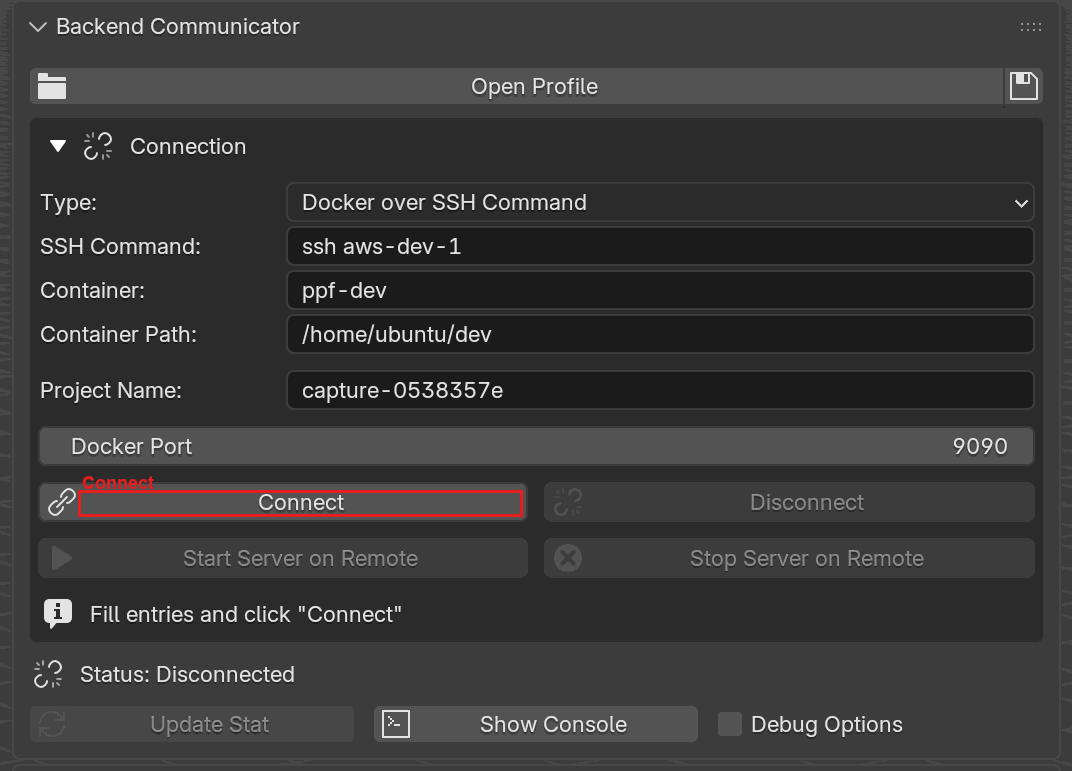
The Backend Communicator panel, with Connect (the button that opens the transport to the solver) highlighted.
Solver
The buttons that drive a simulation: Transfer, Update Params on Remote, Run, Resume, Fetch All Animation, Delete Remote Data, Clear Local Animation, plus Bake buttons. The JupyterLab and MCP Server collapsible sections live inside this panel; see JupyterLab and MCP.
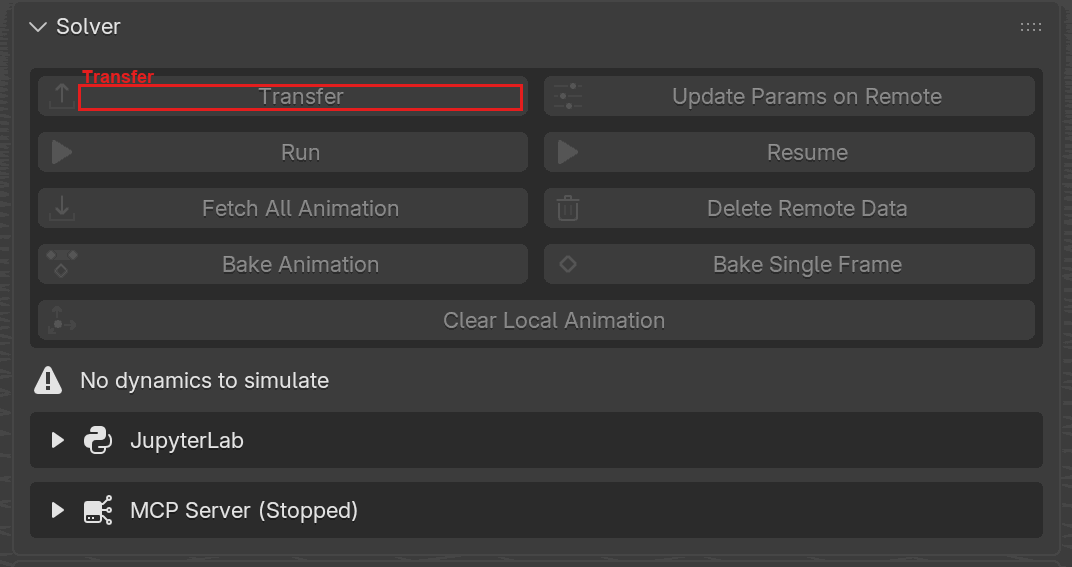
The Solver panel, with Transfer (the button that uploads geometry and parameters to the solver) highlighted.
Scene Configuration
Global solver inputs: FPS, frame count, step size, gravity, air density, air friction. Four collapsible sub-sections: Wind, Advanced Params, Dynamic Parameters (keyframed gravity / wind / air), and Invisible Colliders (walls and spheres).
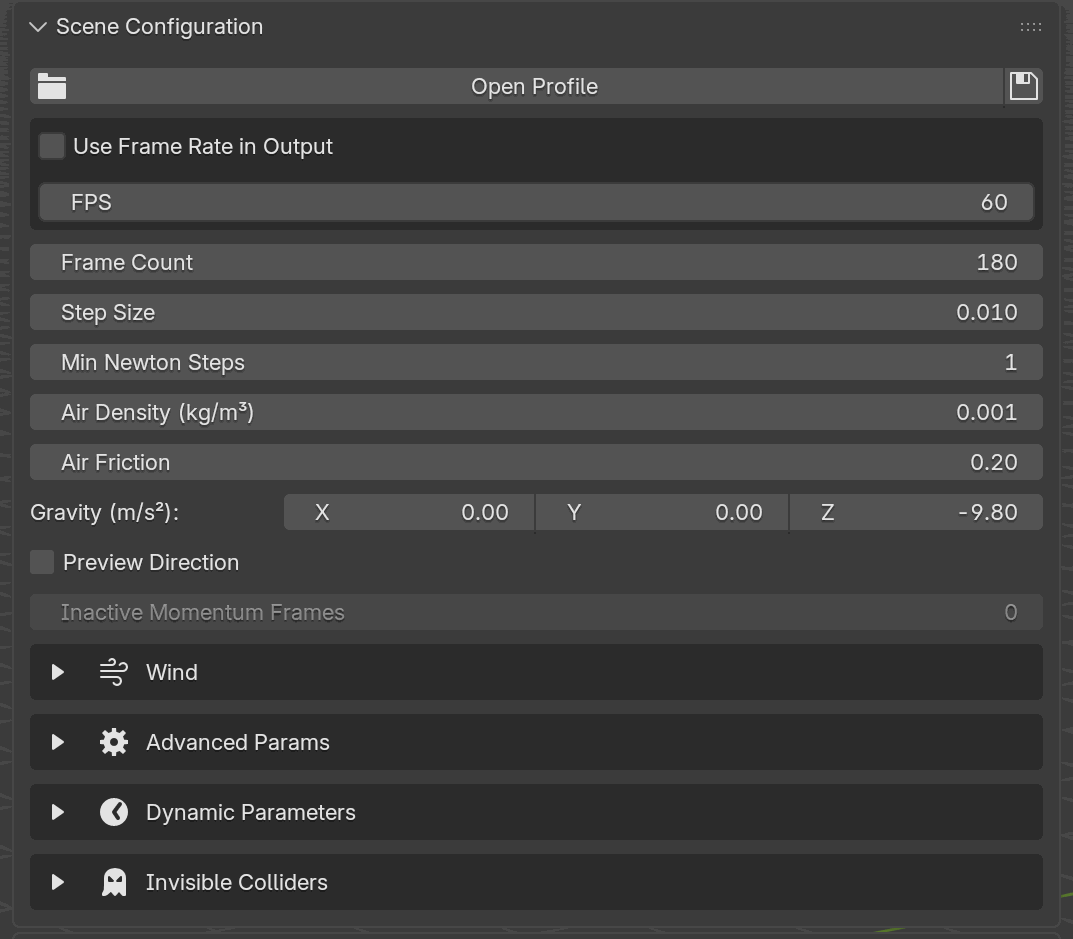
The Scene Configuration panel. Every field here applies to the whole scene; the four collapsible sections at the bottom (Wind, Advanced Params, Dynamic Parameters, and Invisible Colliders) expand to reveal more inputs.
Dynamics Groups
Up to 32 groups. Create a group, pick its type (Solid / Shell / Rod / Static / PDRD / Sand), assign meshes, set per-group material parameters, manage pin vertex groups, and attach pin operations (Move By, Spin, Scale, Torque, Embedded Move).
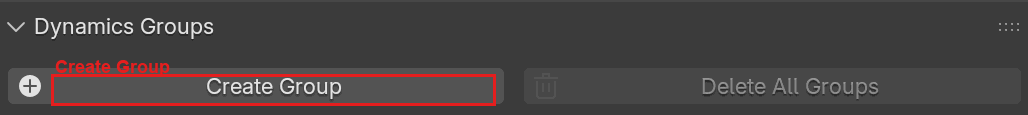
The Dynamics Groups panel in its empty state, with Create Group (the button that allocates a new group slot) highlighted. Each created group appears as its own box below.
Snap and Merge
Snap vertex positions between two objects and register merge pairs so the solver stitches them at build time.
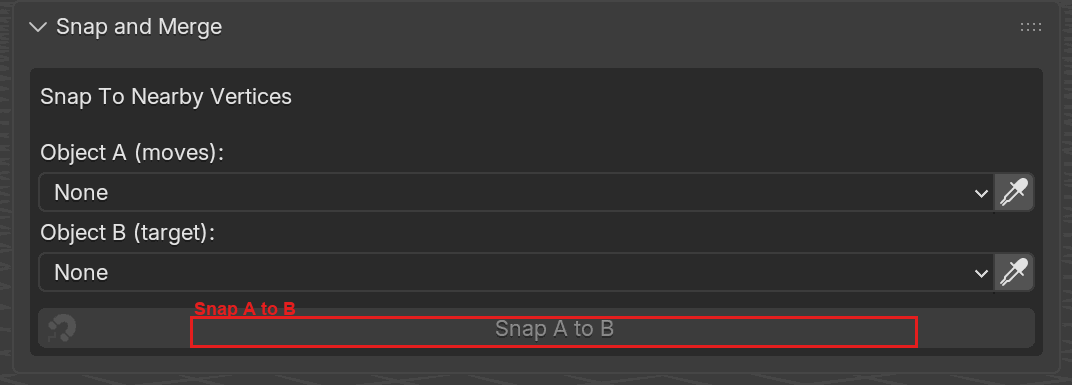
The Snap and Merge panel, with Snap A to B (the KDTree-based vertex snap that pulls Object A’s vertices onto Object B’s closest vertices) highlighted. The panel is collapsed by default; click the header to expand.
Visualization
Toggle overlay draws for group colors, pins, spin/scale centers, and other editing guides.
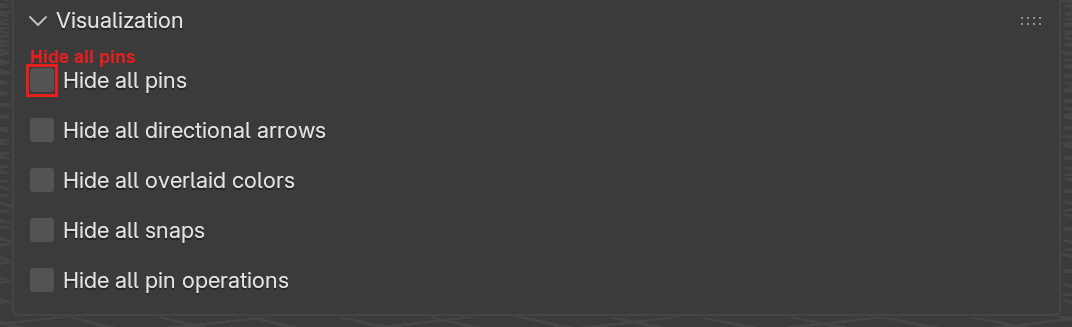
The Visualization panel, with Hide all pins highlighted. Each checkbox hides one overlay category (pins, directional arrows, group color tints, snap indicators, pin operations) so you can declutter the viewport without actually disabling the underlying data.
Other Sections
The Debug tools (Shell Calls, Data Transfer Tests, GitHub Repo on Remote / Local, UUID Migration, and the Add-on Local Debug Server) are hidden behind the Debug Options toggle on the Backend Communicator panel.
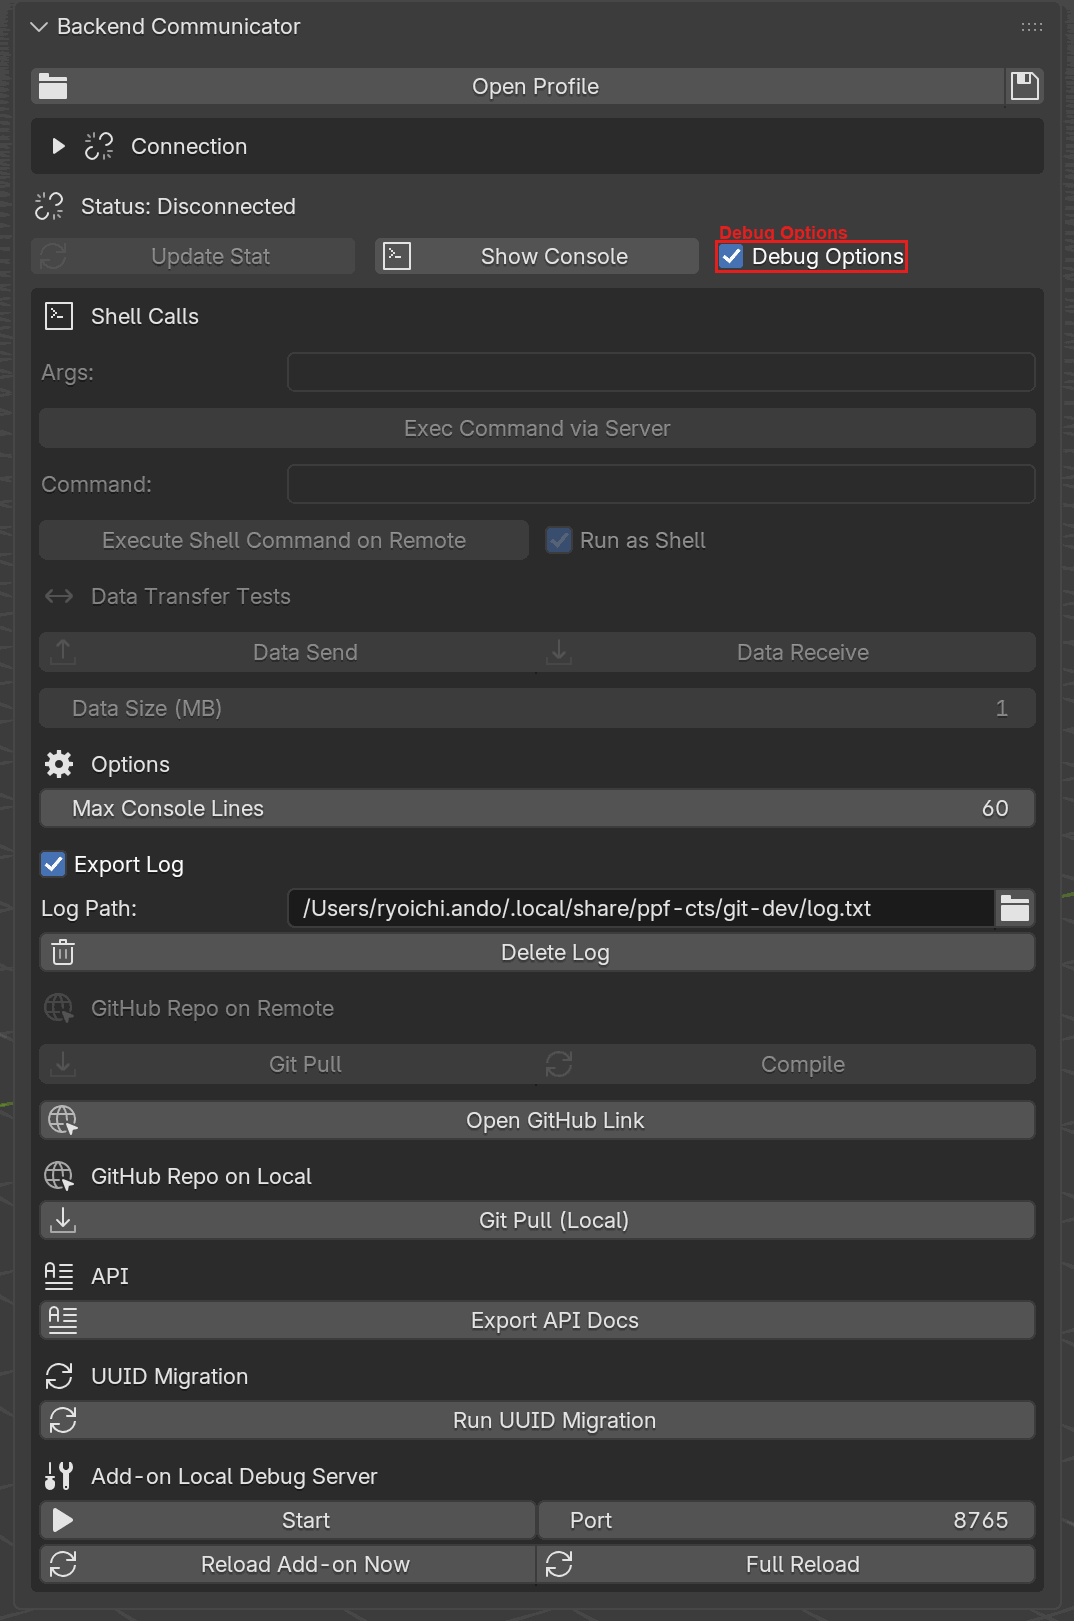
With Debug Options toggled on at the top of the Backend Communicator panel, a debug section appears below exposing Shell Calls, Data Transfer Tests, GitHub Repo on Remote / Local, UUID Migration, and the Add-on Local Debug Server controls.